
Fájl:CO2-417k.png
Az előnézet mérete: 800 × 539 képpont További felbontások: 320 × 216 képpont | 640 × 431 képpont | 1 024 × 690 képpont | 1 200 × 809 képpont.
Eredeti fájl (1 200 × 809 képpont, fájlméret: 16 KB, MIME-típus: image/png)
|
Ez a fájl a Wikimedia Commonsból származik. Az alább látható leírás az ottani dokumentációjának másolata. A Commons projekt szabad licencű kép- és multimédiatár. Segíts te is az építésében! |
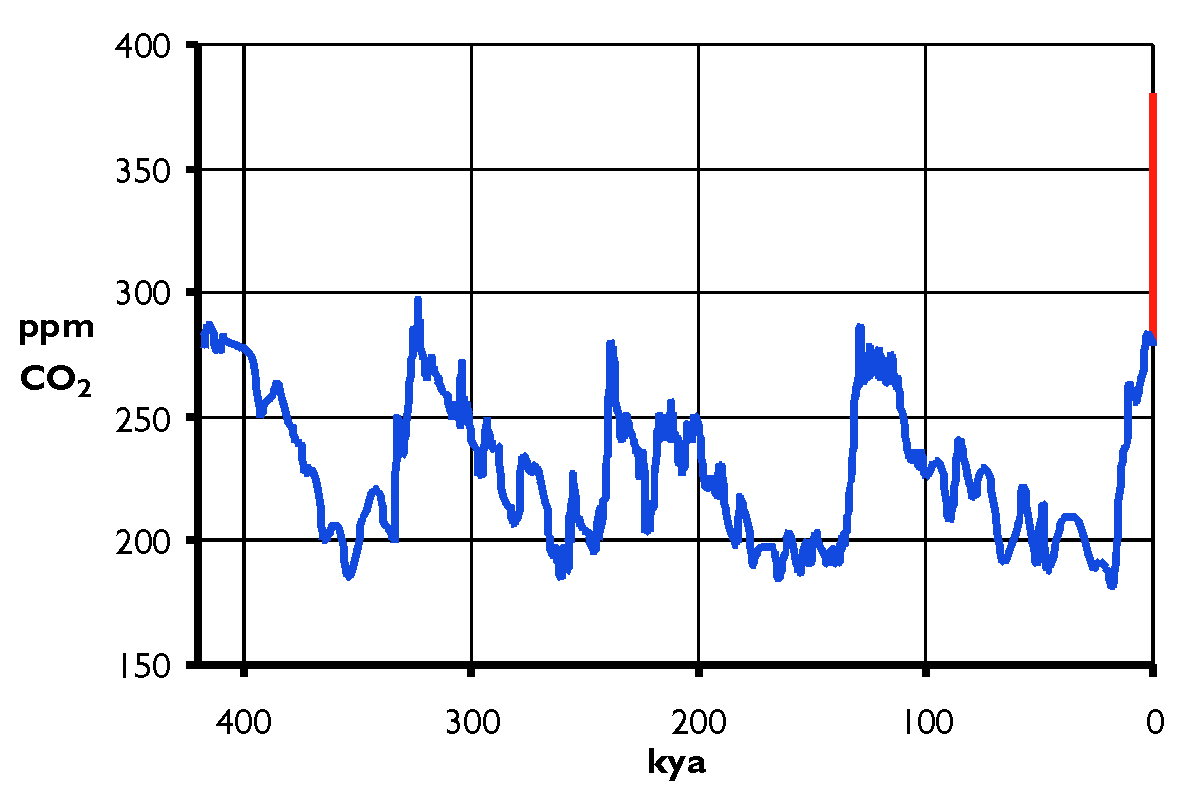
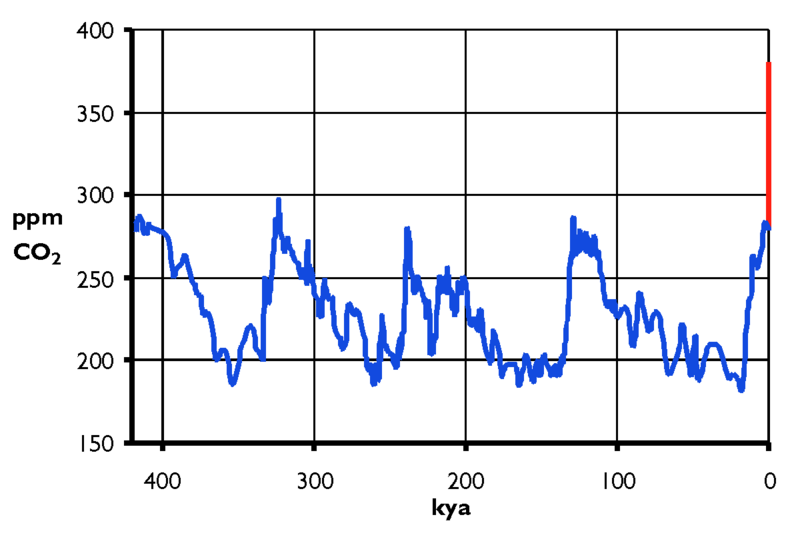
- Description: Atmospheric carbon dioxide concentration during the past 417,000 years (kya = one thousand years ago; i.e., present is at zero, right-hand side). Carbon dioxide levels are expressed as parts per million (volume). The blue part of the curve comes from historical carbon dioxide records from ice cores drilled at the Vostok station in Antarctica. The red part of the curve, on the other hand, illustrates the CO2 increase to 380 ppm between 1800 and today due to anthropogenic emissions from fossil fuels. This increase happened (and happens) on a time scale below the resolution (and outside the time frame) of the Vostok data. The values are taken from other sources instead (see Image:CO2-Temp.png and Image:CO2-Mauna-Loa.png)
- Source: graph drawn by Hanno using data published on the web by J.-M. Barnola, D. Raynaud, C. Lorius & N.I. Barkov (2003) as "Historical carbon dioxide record from the Vostok ice core". In Trends: A Compendium of Data on Global Change. Carbon Dioxide Information Analysis Center, Oak Ridge National Laboratory, U.S. Department of Energy, Oak Ridge, Tenn., U.S.A. [http://cdiac.esd.ornl.gov/trends/co2/vostok.htm]
- Licence: released into the public domain by the originator

|
Ez a kép elérhető vektorgrafikus (SVG) változatban is. Ha jobb minőségű, azt használd e helyett a raszterkép helyett.
File:CO2-417k.png → File:Co2 417k.svg
A vektorgrafikáról a Help:SVG oldalon találsz információkat. |
 |
| Én, a szerző, ezt a művemet ezennel közkinccsé nyilvánítom. Ez a világ minden részén érvényes. Egyes országokban ez jogilag nem lehetséges. Ha így van, akkor: Jogot adok bárkinek, hogy bármilyen célból, feltétel nélkül használhassa ezt a fájlt, kivéve a törvény által kötelezően előírt feltételeket. |
Fájltörténet
Kattints egy időpontra, hogy a fájl akkori állapotát láthasd.
| Dátum/idő | Bélyegkép | Felbontás | Feltöltő | Megjegyzés | |
|---|---|---|---|---|---|
| aktuális | 2005. december 6., 13:42 | | 1 200 × 809 (16 KB) | Hanno |
Fájlhasználat
Az alábbi lap használja ezt a fájlt:
Globális fájlhasználat
A következő wikik használják ezt a fájlt:
- Használata itt: azb.wikipedia.org
- Használata itt: es.wikipedia.org
- Használata itt: kw.wikipedia.org