
Fájl:World energy consumption.svg

Ennek a(z) SVG fájlnak ezen PNG formátumú előnézete: 750 × 560 képpont. További felbontások: 320 × 239 képpont | 640 × 478 képpont | 1 024 × 765 képpont | 1 280 × 956 képpont | 2 560 × 1 911 képpont.
Eredeti fájl (SVG fájl, névlegesen 750 × 560 képpont, fájlméret: 19 KB)
|
Ez a fájl a Wikimedia Commonsból származik. Az alább látható leírás az ottani dokumentációjának másolata. A Commons projekt szabad licencű kép- és multimédiatár. Segíts te is az építésében! |
Összefoglaló
| Leírás |
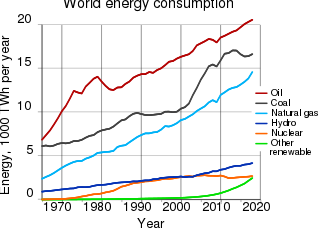
English: World energy consumption. Deutsch: Weltenergiebedarf. |
| Dátum | |
| Forrás | BP Statistical Review of World Energy 2017 |
| Szerző | Con-struct |
| Más változatok |
[]
|
| SVG kód | Ez vektorgrafikus kép Inkscape segítségével készült, or with something else. This file uses embedded text that can be easily translated using a text editor. |
| Note | English: This svg file contains the original graph data. Deutsch: Die svg-Datei enthält die dargestellten Daten als Original-Werte. |
| Template for indication of the source | <ref name="BP-Review-2014">BP: [http://www.bp.com/statisticalreview Statistical Review of World Energy], Workbook (xlsx), London, 2014</ref> |


Generated with Wikimedia SVG Chart
| Data format | The source data of the chart is in the SVG image file in a clearly readable format. You see the original numbers inside of the SVG file in the form of a list such as this:
... 1995 10.06 1996 11.75 1997 12.45 ... |
| Content of SVG | To view the data download the SVG file itself. To do so right-click this link, and then choose the option to save: File:World energy consumption.svg. Launch any text editor. Open the downloaded SVG file with the text editor (usually; file menu, open). To see the list of data, search for the phrase id="graph1". |
| Please, do not use a special SVG editor such as Inkscape; the readability of the database would be destroyed. You can edit the SVG file with any text editor, for example; en: List of text editors. You can view the edited SVG file in various web browsers. As of 2011, all major desktop browsers, and many minor ones, have some level of SVG support. See: en: Scalable Vector Graphics#Support for SVG in web browsers. When satisfied with your edits, upload the edited SVG file with the link labeled "Upload a new version of this file".
W3C-validity not checked. This chart was created with Wikimedia SVG Chart. This chart uses embedded text/digits. |
|
| Code to generate SVG | See: File talk:World energy consumption.svg. Documentation see: Wikimedia SVG Chart. |
Conversions

| - Power in Watt | |
| - Power in toe (tonne of oil equivalent) | |
| - Conversion factor of tonne of oil equivalent to watt, 11.63 megawatt hours / toe | |
| - Energy conversion efficiency, 38%, see BP statistical_review_of_world_energy_2013.pdf |


Example
| , statistical_review_of_world_energy_2013_workbook.xlsx, tab "Oil Production – tonnes", cell "AW89" | |
| , see Terawatt |


The conversion factor is exactly 4.4194 TWh/Mtoe, according to the ...workbook.xlsx, tab "Approximate conversion factors".
Licenc
Én, e mű szerzője a művemet az alábbi licencek alatt teszem közzé:

|
Ez a fájl szabadon másolható, terjeszthető és/vagy módosítható a GNU Szabad Dokumentációs Licenc feltételei alapján, az 1.2 vagy későbbi, a Free Software Foundation által publikált Nem Változtatható szakaszok, Címlapszövegek és Hátlapszövegek nélküli változat szerint. E licenc egy példánya a GNU Szabad Dokumentációs Licenc című fejezetben olvasható. |
Ez a fájl a Creative Commons Nevezd meg! – Így add tovább! 3.0 Unported, 2.5 Általános, 2.0 Általános és 1.0 Általános licencek alapján használható fel.
- A következőket teheted a művel:
- megoszthatod – szabadon másolhatod, terjesztheted, bemutathatod és előadhatod a művet
- feldolgozhatod – származékos műveket hozhatsz létre
- Az alábbi feltételekkel:
- Nevezd meg! – A szerzőt megfelelően fel kell tüntetned, hivatkozást kell létrehoznod a licencre és jelezned kell, ha a művön változtatást hajtottál végre. Ezt bármilyen észszerű módon megteheted, kivéve oly módon, ami azt sugallná hogy a jogosult támogat téged vagy a felhasználásod körülményeit.
- Így add tovább! – Ha megváltoztatod, átalakítod, feldolgozod ezt a művet, a közreműködésedet csak az eredetivel megegyező vagy hasonló licenc alatt terjesztheted.
A mű a fenti licencek bármelyike szerint felhasználható.
Fájltörténet
Kattints egy időpontra, hogy a fájl akkori állapotát láthasd.
| Dátum/idő | Bélyegkép | Felbontás | Feltöltő | Megjegyzés | |
|---|---|---|---|---|---|
| aktuális | 2022. január 14., 01:38 | | 750 × 560 (19 KB) | TAKAHASHI Shuuji | File uploaded using svgtranslate tool (https://svgtranslate.toolforge.org/). Added translation for ja. |
| 2019. július 25., 23:54 |  | 750 × 560 (18 KB) | Wiklol | update; source: http://web.archive.org/web/20190616172232/https://www.bp.com/content/dam/bp/business-sites/en/global/corporate/xlsx/energy-economics/statistical-review/bp-stats-review-2019-all-data.xlsx | |
| 2017. december 5., 00:43 |  | 750 × 560 (106 KB) | Delphi234 | update | |
| 2016. június 11., 11:59 |  | 750 × 520 (104 KB) | Delphi234 | update | |
| 2015. szeptember 13., 07:29 |  | 750 × 520 (132 KB) | Delphi234 | remove transparency | |
| 2015. szeptember 13., 07:22 |  | 750 × 520 (132 KB) | Delphi234 | remove transparency | |
| 2015. szeptember 13., 07:16 |  | 750 × 520 (131 KB) | Delphi234 | convert text to path | |
| 2015. szeptember 13., 06:23 |  | 750 × 520 (16 KB) | Delphi234 | update | |
| 2014. június 20., 06:26 |  | 750 × 520 (17 KB) | Delphi234 | fix typo | |
| 2014. június 20., 06:23 |  | 750 × 520 (17 KB) | Delphi234 | fix typo |
Fájlhasználat
Az alábbi lap használja ezt a fájlt:
Globális fájlhasználat
A következő wikik használják ezt a fájlt:
- Használata itt: ar.wikipedia.org
- Használata itt: cs.wikipedia.org
- Használata itt: en.wikipedia.org
- Használata itt: es.wikipedia.org
- Használata itt: fa.wikipedia.org
- Használata itt: fr.wikipedia.org
- Használata itt: ha.wikipedia.org
- Használata itt: io.wikipedia.org
- Használata itt: ml.wikipedia.org
- Használata itt: pt.wikipedia.org
- Használata itt: sl.wikipedia.org
- Használata itt: sv.wikipedia.org
- Használata itt: th.wikipedia.org
- Használata itt: uk.wikipedia.org
- Használata itt: vi.wikipedia.org
- Chất dẻo
- Ấm lên toàn cầu
- Sản xuất chế tạo
- Anthropocene
- Đánh giá tác động môi trường
- Phá hủy sinh cảnh
- Bản mẫu:Tác động của con người với môi trường
- Thành viên:GregKaye
- Trồng rừng
- Population Matters
- Nông nghiệp hữu cơ
- Mỏ đá
- Vấn đề môi trường
- Tác động môi trường của dược phẩm và các sản phẩm chăm sóc cá nhân
- Tái trồng rừng
- Chu trình photpho
- Suy thoái đất
- Tác động môi trường của giấy
- Tác động của con người đến môi trường
- Mất đa dạng sinh học
- Tác động của công nghiệp năng lượng lên môi trường
- Tác động của sơn đến môi trường
A fájl globális használatának megtekintése