Fájl:Ukrainian parliamentary election, 2007 (VoteByRegion).PNG

Az oldal más nyelven nem érhető el.
A Wikipédiából, a szabad enciklopédiából

Ukrainian_parliamentary_election,_2007_(VoteByRegion).PNG(769 × 477 képpont, fájlméret: 16 KB, MIME-típus: image/png)

Összefoglaló

Leírás
Dátum
Forrás Self-made based off map by Muumi with data from Central Election Commission of Ukraine
Szerző User:DemocracyATwork
Engedély
(Fájl újrafelhasználása)
w:hu:Creative Commons
Nevezd meg! Így add tovább!
Ez a fájl a Creative Commons Nevezd meg! – Így add tovább! 1.0 Általános licenc alapján használható fel.
Így nevezd meg: DemocracyATwork
A következőket teheted a művel:
  • megoszthatod – szabadon másolhatod, terjesztheted, bemutathatod és előadhatod a művet
  • feldolgozhatod – származékos műveket hozhatsz létre
Az alábbi feltételekkel:
  • Nevezd meg! – A szerzőt megfelelően fel kell tüntetned, hivatkozást kell létrehoznod a licencre és jelezned kell, ha a művön változtatást hajtottál végre. Ezt bármilyen észszerű módon megteheted, kivéve oly módon, ami azt sugallná hogy a jogosult támogat téged vagy a felhasználásod körülményeit.
  • Így add tovább! – If you alter, transform, or build upon this work, you must distribute the resulting work under the same license as the original.
Más változatok

Collection

Results of the parliamentary elections:
Politcal alignment 2007
Vote percenatge 2006 to 2007 (Top Six parties)
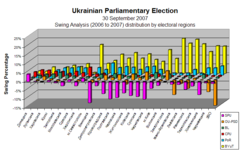
Swing 2006 to 2007 (Top Six parties)

Regional Analysis of the parliamentary elections:

Highest Vote per region
Charts showing the top six parties support - percentage of total national vote and Electoral Region
Vote Percentage by Electoral Region Vote Percentage by Electoral Region Swing by Electoral Regions
Maps showing the top six parties support - percentage of total national vote
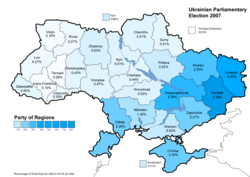
Party of Regions results (34.37%)
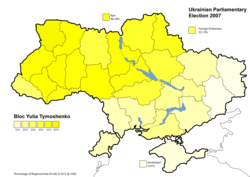
Bloc Yulia Tymoshenko results (30.71%
Our Ukraine People's Self-Defence results (14.15%)
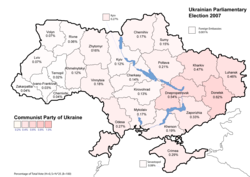
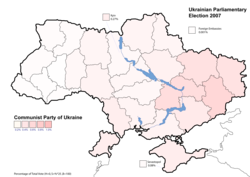
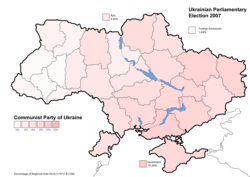
Communist Party of Ukraine results (5.39%)
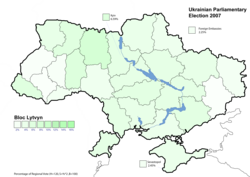
Bloc Lytvyn Party results (3.96%)
Socialist Party of Ukraine results (2.86%)
Maps showing the top six parties support - percentage of total national vote (Minimal text)
Party of Regions results (34.37%)
Bloc Yulia Tymoshenko results (30.71%
Our Ukraine People's Self-Defence results (14.15%)
Communist Party of Ukraine results (5.39%)
Bloc Lytvyn Party results (3.96%)
Socialist Party of Ukraine results (2.86%)
Maps showing the top six parties support - percentage per region
Party of Regions results (34.37%)
Bloc Yulia Tymoshenko results (30.71%
Our Ukraine People's Self-Defence results (14.15%)
Communist Party of Ukraine results (5.39%)
Bloc Lytvyn Party results (3.96%)
Socialist Party of Ukraine results (2.86%)


2007 [1] [2] [3] [4] [5] [6]

2006 [7] [8] [9] [10] [11] [12]

A swing analysis is common in any election. It shows the change in voter percentage for each party by regions from 2006 to 2007.

Licenc

Public domain Én, a szerző, ezt a művemet ezennel közkinccsé nyilvánítom. Ez a világ minden részén érvényes.
Egyes országokban ez jogilag nem lehetséges. Ha így van, akkor:
Jogot adok bárkinek, hogy bármilyen célból, feltétel nélkül használhassa ezt a fájlt, kivéve a törvény által kötelezően előírt feltételeket.
  1. Template:Cite gov
  2. Template:Cite gov
  3. Template:Cite gov
  4. Template:Cite gov
  5. Template:Cite gov
  6. Template:Cite gov
  7. Template:Cite gov
  8. Template:Cite gov
  9. Template:Cite gov
  10. Template:Cite gov
  11. Template:Cite gov
  12. Template:Cite gov

Képaláírások

Adj meg egy egysoros magyarázatot arról, hogy mit mutat be ez a fájl

A fájl által ábrázolt elemek

mű tárgya

11. február 2008

Fájltörténet

Kattints egy időpontra, hogy a fájl akkori állapotát láthasd.

Dátum/időBélyegképFelbontásFeltöltőMegjegyzés
aktuális2008. február 20., 19:08Bélyegkép a 2008. február 20., 19:08-kori változatról769 × 477 (16 KB)DemocracyATworkUkrainian Parliamentary Election 2007 Results of election (Top six parties by regional percentage ) chart. Removed boarder.
2008. február 18., 01:08Bélyegkép a 2008. február 18., 01:08-kori változatról749 × 478 (15 KB)DemocracyATworkUpdate to reflect color change for Bloc Lytvyn to match with the Parliamentary seat allocation map. From grey to geen.
2008. február 13., 16:19Bélyegkép a 2008. február 13., 16:19-kori változatról749 × 478 (15 KB)DemocracyATwork== Summary == {{Information |Description='''English:''' Ukrainian parliamentary election, 2007 sorted to better correlate to data table. |Source=Self-made based off [[:Image:Wahlkreise ukraine 2006 eng.png|ma
2008. február 6., 16:41Bélyegkép a 2008. február 6., 16:41-kori változatról749 × 478 (19 KB)File Upload Bot (Magnus Manske) {{BotMoveToCommons|uk.wikipedia}} {{Information |Description={{uk|uk:?????????:?????????? 2007 http://www.cvk.gov.ua/pls/vnd2007/W6P320?PT001F01=600&pPlace=1 http://www.cvk.gov.ua/pls/vnd2007/W6P320?PT001F01=600&pPlace=2 http://www.c

Az alábbi lap használja ezt a fájlt:

Globális fájlhasználat