
Fájl:Chunnel traffic.svg

Ennek a(z) SVG fájlnak ezen PNG formátumú előnézete: 750 × 500 képpont. További felbontások: 320 × 213 képpont | 640 × 427 képpont | 1 024 × 683 képpont | 1 280 × 853 képpont | 2 560 × 1 707 képpont.
Eredeti fájl (SVG fájl, névlegesen 750 × 500 képpont, fájlméret: 23 KB)
|
Ez a fájl a Wikimedia Commonsból származik. Az alább látható leírás az ottani dokumentációjának másolata. A Commons projekt szabad licencű kép- és multimédiatár. Segíts te is az építésében! |
Összefoglaló
| Leírás |
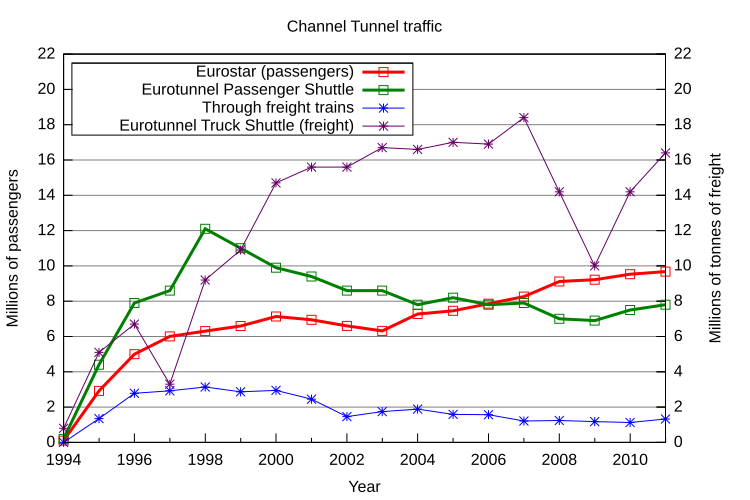
English: A graph of traffic through the Chunnel, 1994–2010
Français : Graphique décrivant le trafic du tunnel sous la Manche (1994–2010) |
| Dátum | |
| Forrás | A feltöltő saját munkája |
| Szerző | Nkocharh |
| Engedély (Fájl újrafelhasználása) |
In the public domain |
| Más változatok | Version française |
Licenc
| Én, a szerző, ezt a művemet ezennel közkinccsé nyilvánítom. Ez a világ minden részén érvényes. Egyes országokban ez jogilag nem lehetséges. Ha így van, akkor: Jogot adok bárkinek, hogy bármilyen célból, feltétel nélkül használhassa ezt a fájlt, kivéve a törvény által kötelezően előírt feltételeket. |
Actual Eurostar, Le Shuttle, and freight figures
Year Passengers transported... Freight transported... by Eurostar[A] [1][2] by Eurotunnel
Passenger
Shuttles[1][3]
(estimated,
millions)
Total
(estimated,
millions)
by through
freight trains[2]
(tonnes)by Eurotunnel
Truck
Shuttles[1][3]
(estimated,
million tonnes)
Total
(estimated,
million tonnes)1994 ~100,000[3] 0.2 0.3 0 0.8[3] 0.8 1995 2,920,309 4.4 7.3 1,349,802 5.1 6.4 1996 4,995,010 7.9 12.9 2,783,774 6.7 9.5 1997 6,004,268 8.6 14.6 2,925,171 3.3 6.2 1998 6,307,849 12.1 18.4 3,141,438 9.2 12.3 1999 6,593,247 11.0 17.6 2,865,251 10.9 13.8 2000 7,130,417 9.9 17.0 2,947,385 14.7 17.6 2001 6,947,135 9.4 16.3 2,447,432 15.6 18.0 2002 6,602,817 8.6 15.2 1,463,580 15.6 17.1 2003 6,314,795 8.6 14.9 1,743,686[4] 16.7 18.4 2004 7,276,675 7.8 15.1 1,889,175[5] 16.6 18.5 2005 7,454,497 8.2 15.7 1,587,790[5] 17.0 18.6 2006 7,858,337 7.8 15.7 1,569,429[6] 16.9 18.5 2007 8,260,980 9,5[7] 17.7 1,213,647[6] 18.4 19.6 2008 9,113,371 8,4[7] 17.5 1,239,445 [8] 14.2 15.4 2009 9,220,233 7,8[7] 17.0 1,181,089[8] 10.0 11.2 2010[9] 9,528,558 8,8[7] 18.3 1,128,079[10] 14.2 15.3 2011 9,679,764 9,3[7] 19.0 1,324,673[11] 16.4 17.7 2012 9 911 649 10 19.9 1,230,000[7] 19 19,2 2013 10 132 691 10,3 20.4 1,360,000[7] 17,7 19,1 2014 10 397 894 10,6 21.0 1,650,000[7] 18,7 20,4 2015 10 399 267 10,5 20.9 1,420,000[7] 19,3 20,7 2016 10 011 337 10,6 20.6 1,040,000[7] 21,3 22,3 ^A only passengers taking Eurostar to cross the Channel
References
- ↑ a b c Traffic figures. Eurotunnel. Retrieved on 2009-01-15.
- ↑ a b Study Report Annex 2. Initial East Kent and Ashford Sub-Regional Study for The South East Plan Table 11. South East England Regional Assembly (June 2004). Archived from the original on 2007-11-08. Retrieved on 2009-01-21.
- ↑ a b c d Ricard Anguera (May 2006). "The Channel Tunnel—an ex post economic evaluation". Transportation Research Part A: Policy and Practice 40 (4): 291-315.
- ↑ Eurotunnel 2003 Revenue & Traffic. Eurotunnel (2004-01-20). Retrieved on 2009-01-21.
- ↑ a b Eurotunnel: 2005 Traffic and revenue figures.. Eurotunnel (2006-01-16). Retrieved on 2009-01-21.
- ↑ a b Eurotunnel 2007 Traffic and Revenue figures: a remarkable year. Eurotunnel (2008-01-15). Retrieved on 2009-01-21.
- ↑ a b c d e f g h i j Traffic figures. Eurotunnel. Archived from the original on 2015-05-13. Retrieved on 2017-08-05.
- ↑ a b Eurotunnel 2009 traffic and revenue figures. Eurotunnel (2010-01-10). Archived from the original on 2011-08-07. Retrieved on 2011-02-06.
- ↑ Traffic figures. Eurotunnel. Archived from the original on 2015-05-13. Retrieved on 2011-02-06.
- ↑ Eurotunnel 2010 traffic and revenue figures. Eurotunnel (2011-01-18). Archived from the original on 2011-07-10. Retrieved on 2011-02-06.
- ↑ 2011 ANNUAL RESULTS. Eurotunnel. Archived from the original on 2014-08-07. Retrieved on 2012-11-03.
Data used in this plot
This is the chunnel.dat file which was used in combination with the gnuplot file below to create this graph:
# Chunnel traffic figures.
# Original data:
# http://en.wikipedia.org/wiki/File:Chunnel_traffic.svg
# Figures in millions of passengers resp. tonnes
#
Year	Eurostar (passengers)	Eurotunnel Passenger Shuttle	Through freight trains	Eurotunnel Truck Shuttle (freight)
1994	0.100000	0.2	0.000000	0.8
1995	2.920309	4.4	1.349802	5.1
1996	4.995010	7.9	2.783774	6.7
1997	6.004268	8.6	2.925171	3.3
1998	6.307849	12.1	3.141438	9.2
1999	6.593247	11	2.865251	10.9
2000	7.130417	9.9	2.947385	14.7
2001	6.947135	9.4	2.447432	15.6
2002	6.602817	8.6	1.463580	15.6
2003	6.314795	8.6	1.743686	16.7
2004	7.276675	7.8	1.889175	16.6
2005	7.454497	8.2	1.587790	17
2006	7.858337	7.8	1.569429	16.9
2007	8.260980	7.9	1.213647	18.4
2008	9.113371	7	1.239445	14.2
2009	9.220233	6.9	1.181089	10.0
2010	9.528558	7.5	1.128079	14.2
2011	9.679764	7.8	1.324673	16.4
Gnuplot file used to make this graph
This is the gnuplot file used to make this graph:
set terminal svg enhanced fsize 12 size 750,500
set output 'chunnel traffic.svg'
set datafile missing '-'
set datafile separator "\t"
set style data linespoints

set title "Channel Tunnel traffic"

set xlabel "Year"
set xdata time
set timefmt '%Y'
set xtics nomirror
set mxtics 2
set xrange ["1994":"2011"]
set format x "%Y"

set ytics 2
set y2tics 2
set ylabel "Millions of passengers"
set y2label "Millions of tonnes of freight"
set grid noxtics
set grid ytics
set key on inside left top box
set key autotitle columnhead
set yrange [0:22]
set y2range [0:22]

set style line 1 lw 3 pt 4 # for Eurostar passengers
set style line 2 lw 3 pt 4 # for Le Shuttle passengers
set style line 3 pt 3 # for Le Shuttle freight
set style line 4 pt 3 lc rgb "#660066" # for Through freight

plot 'chunnel.dat' using 1:2 linestyle 1, '' u 1:3 ls 2, '' u 1:4 ls 3, '' u 1:5 ls 4
Fájltörténet
Kattints egy időpontra, hogy a fájl akkori állapotát láthasd.
| Dátum/idő | Bélyegkép | Felbontás | Feltöltő | Megjegyzés | |
|---|---|---|---|---|---|
| aktuális | 2013. augusztus 8., 17:02 | | 750 × 500 (23 KB) | XZise | fixed the value for Eurotunnel Truck Shuttle in 2009 |
| 2013. április 23., 14:16 |  | 750 × 500 (23 KB) | Nkocharh | Added 2011 numbers | |
| 2011. február 6., 18:26 |  | 750 × 500 (24 KB) | Rontombontom | 2010 numbers | |
| 2010. október 2., 23:37 |  | 750 × 500 (23 KB) | Rontombontom | Scale changed to give space for key | |
| 2010. október 1., 11:56 |  | 750 × 500 (23 KB) | Rontombontom | Updated with 2009 data | |
| 2010. augusztus 29., 04:05 |  | 750 × 500 (23 KB) | MetalGearLiquid | fixing a bug with the cyan crosses/purple curve (wikimedia puts purple on both the line & the crosses, but Firefox respects the SVG code & put cyan crosses with purple line; new code uses purple for both the curve and the crosses) | |
| 2009. február 17., 08:51 |  | 750 × 500 (23 KB) | Nkocharh | Added 2008 data, changed legend to reflect current service names. | |
| 2008. március 14., 19:27 |  | 750 × 500 (22 KB) | Nkocharh | Oh, wait, no it wasn't. Changed the title back. | |
| 2008. március 14., 19:24 |  | 750 × 500 (22 KB) | Nkocharh | Title was wrong. | |
| 2008. március 14., 19:14 |  | 750 × 500 (22 KB) | Nkocharh | {{Information |Description=A graph of traffic through the Chunnel, 1994–2007 |Source=self-made |Date=14 March 2008 |Author= Nkocharh |Permission=In the public domain |other_versions= }} |
Fájlhasználat
Az alábbi lap használja ezt a fájlt:
Globális fájlhasználat
A következő wikik használják ezt a fájlt:
- Használata itt: ast.wikipedia.org
- Használata itt: ca.wikipedia.org
- Használata itt: en.wikipedia.org
- Használata itt: es.wikipedia.org
- Használata itt: vi.wikipedia.org
- Használata itt: zh.wikipedia.org