
Fájl:Butterworth filter bode plot.png

Az előnézet mérete: 800 × 560 képpont További felbontások: 320 × 224 képpont | 640 × 448 képpont | 1 024 × 717 képpont | 1 250 × 875 képpont.
Eredeti fájl (1 250 × 875 képpont, fájlméret: 110 KB, MIME-típus: image/png)
|
Ez a fájl a Wikimedia Commonsból származik. Az alább látható leírás az ottani dokumentációjának másolata. A Commons projekt szabad licencű kép- és multimédiatár. Segíts te is az építésében! |
Összefoglaló
| Leírás |
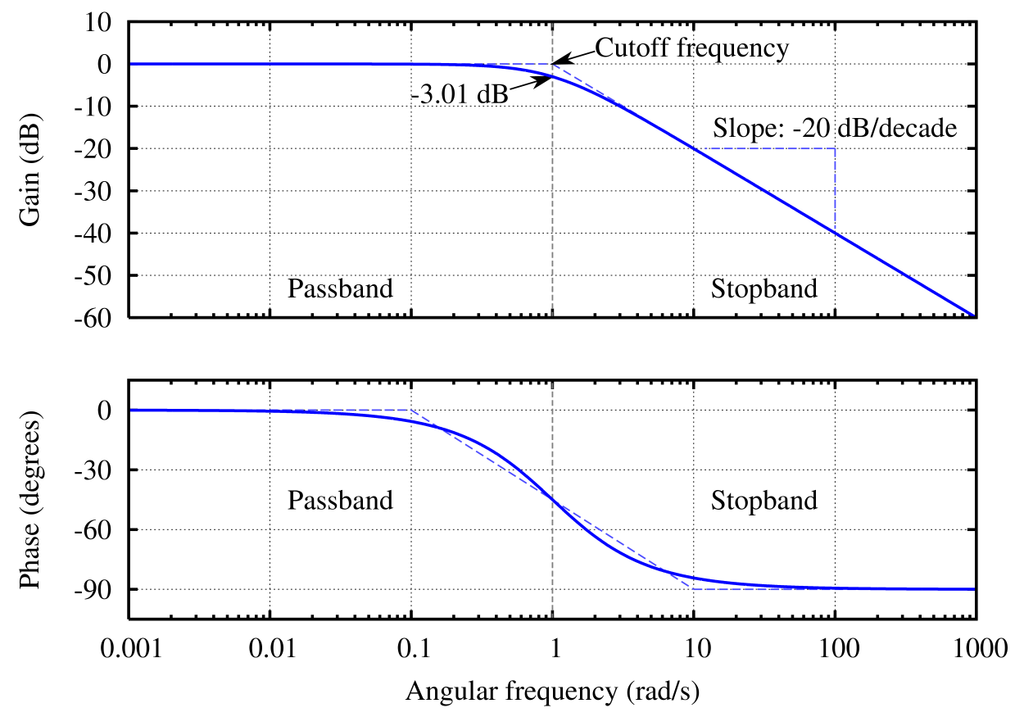
English: The Bode plot of a Butterworth filter with logarithmic axes and various labels. Cutoff frequency is normalized to 1 rad/s. Gain is normalized to 0 dB in the passband. Phase is in degrees because that's typical. The code is kind of kludgy, but makes a good output. See Wikipedia graph-making tips. Generated in gnuplot with the script below (save as butterworth_bode_plot.plt and then open in gnuplot). Then I opened the butterworth_bode_plot.ps file in a text editor to edit the line colors and linestyles, as per this description. This avoids needing to open in proprietary software, and really isn't that difficult (especially if you don't know the commands in the proprietary software either). ;-) Identify the lines easily by their color (the arrow is currently magenta and I want it to be black. Ah, there is the entry with 1 0 1, red + blue = magenta) or by using the gnuplot linestyle−1. (For instance, gnuplot's linestyle 3 corresponds to the ps file's /LT2.) Then you can edit the colors and dashes by hand. I changed the original: /LT0 { PL [] 1 0 0 DL } def
/LT1 { PL [4 dl 2 dl] 0 1 0 DL } def
/LT2 { PL [2 dl 3 dl] 0 0 1 DL } def
/LT3 { PL [1 dl 1.5 dl] 1 0 1 DL } def
into this: /LT0 { PL [] 0 0 1 DL } def
/LT1 { PL [4 dl 2 dl] 0.5 0.5 0.5 DL } def
/LT2 { PL [6 dl 3 dl] 0.3 0.3 1 DL } def
/LT3 { PL [] 0 0 0 DL } def
/LT4–/LT8 I left unchanged. (I don't know what they're used for anyway.) /LTw, /LTb, and /LTa are for the grid lines and such. To convert the PostScript file to PNG:
Ez PNG számítógépes grafika Gnuplot segítségével készült. |
| Dátum | 2005. október 8. (feltöltés ideje) |
| Forrás | A feltöltő saját munkája |
| Szerző | Omegatron |
| Más változatok |
[]
.png:
|
| gnuplot source | click to expand
set samples 2001
set terminal postscript enhanced landscape color lw 2 "Times-Roman" 20
set output "butterworth bode plot.ps"

# Butterworth amplitude response and decibel calculation.  n is the order, which is just 1 in this image.
G(w,n) = 1 / (sqrt(1 + w**(2*n)))
dB(x) = 20 * log10(abs(x))
# Phase is for first order
P(w) = -pi/2-atan(1.2*w)-atan(0.09*w)

# Gridlines
set grid

# Set x axis to logarithmic scale
set logscale x 10

# No need for a key
set nokey #0.1,-25

# Frequency response's line plotting style
set style line 1 lt 1 lw 2

# Asymptote lines and slope lines are the same "arrow" style
set style line 3 lt 3 lw 1
set style arrow 3 nohead ls 3

# -3 dB arrow style
set style line 4 lt 4 lw 1
set style arrow 4 head filled size screen 0.02,15,45 ls 4

# Separator between passband and stopband line style
set style line 2 lt 2 lw 1
set style arrow 2 nohead ls 2

set multiplot

# Magnitude response
# =============================================
set size 1,0.5
set origin 0,0.5

# Set range of x and y axes
set xrange [0.001:1000]
set yrange [-60:10]

# Create x-axis tic marks once per decade (every multiple of 10)
set xtics 10
#set ytics 10

# No need for two sets of numbers
set format x ""

# Use 10 x-axis minor divisions per major division
set mxtics 10

# Axis labels
set ylabel "Gain (dB)"

# Draw asymptote lines
set arrow 1 from 1,0 to 1000,-60 as 3
set arrow 2 from .001,0 to 1,0 as 3

# -3 dB arrow
set arrow 4 from 2,3 to 1,0 as 4

# "Cutoff frequency" label uses same coordinates as the function
set label 3 "Cutoff frequency" at 2,4 l

# "-3 dB" label
set arrow 5 from 0.5,-6 to 1,-3 as 4
set label 4 "-3.01 dB" at 0.5,-7 r

# Draw a separator between passband and stopband and label them
set arrow 3 from 1,-60 to 1,10 as 2

# Label coordinates are relative to the graph window, not to the function, centered at the 1/4 and 3/4 width points
set label 1 "Passband" at graph 0.25, graph 0.1 c
set label 2 "Stopband" at graph 0.75, graph 0.1 c

# Draw slope lines and label
set arrow 6 from 100,-20 to 12,-20 as 3
set arrow 7 from 100,-20 to 100,-39 as 3
set label 5 "Slope: -20 dB/decade" at 100,-15 c

plot dB(G(x,1)) ls 1  title "1st-order response"

#Phase response
# =============================================
set size 1,0.5
set origin 0,0

# Set range of x and y axes
set yrange [-105:15]

# Create y-axis tic marks every 15 degrees
set ytics 30

# Regular numbers
set format x "% g"

# Axis labels
set ylabel "Phase (degrees)"
set xlabel "Angular frequency (rad/s)"

# Draw asymptote lines
set arrow 1 from 0.1,0 to 10,-90 as 3
set arrow 2 from 0.001,0 to 0.1,0 as 3
set arrow 10 from 10,-90 to 1000,-90 as 3

# -3 dB arrow
unset arrow 4 #from 2,3 to 1,0 as 4

# "Cutoff frequency" label uses same coordinates as the function
unset label 3 #"Cutoff frequency" at 2,4 l

# "-3 dB" label
unset arrow 5 #from 0.5,-6 to 1,-3 as 4
unset label 4 #"-3.01 dB" at 0.5,-7 r

# Draw a separator between passband and stopband and label them
set arrow 3 from 1,-105 to 1,15 as 2

# Label coordinates are relative to the graph window, not to the function, centered at the 1/4 and 3/4 width points
set label 1 "Passband" at graph 0.25, graph 0.5 c
set label 2 "Stopband" at graph 0.75, graph 0.5 c

# Draw slope lines and label
unset arrow 6 #from 100,-20 to 12,-20 as 3
unset arrow 7 #from 100,-20 to 100,-39 as 3
unset label 5 #"Slope: -20 dB/decade" at 100,-18 c

plot P(x) ls 1 title "Phase response"

unset multiplot
|


|
Ez a kép elérhető vektorgrafikus (SVG) változatban is. Ha jobb minőségű, azt használd e helyett a raszterkép helyett.
File:Butterworth filter bode plot.png → File:Butterworth filter bode plot.svg
A vektorgrafikáról a Help:SVG oldalon találsz információkat. |
 |
Licenc
Én, e mű szerzője a művemet az alábbi licencek alatt teszem közzé:
Ez a fájl a Creative Commons Nevezd meg! – Így add tovább! 3.0 Unported, 2.5 Általános, 2.0 Általános és 1.0 Általános licencek alapján használható fel.
- A következőket teheted a művel:
- megoszthatod – szabadon másolhatod, terjesztheted, bemutathatod és előadhatod a művet
- feldolgozhatod – származékos műveket hozhatsz létre
- Az alábbi feltételekkel:
- Nevezd meg! – A szerzőt megfelelően fel kell tüntetned, hivatkozást kell létrehoznod a licencre és jelezned kell, ha a művön változtatást hajtottál végre. Ezt bármilyen észszerű módon megteheted, kivéve oly módon, ami azt sugallná hogy a jogosult támogat téged vagy a felhasználásod körülményeit.
- Így add tovább! – Ha megváltoztatod, átalakítod, feldolgozod ezt a művet, a közreműködésedet csak az eredetivel megegyező vagy hasonló licenc alatt terjesztheted.

|
Ez a fájl szabadon másolható, terjeszthető és/vagy módosítható a GNU Szabad Dokumentációs Licenc feltételei alapján, az 1.2 vagy későbbi, a Free Software Foundation által publikált Nem Változtatható szakaszok, Címlapszövegek és Hátlapszövegek nélküli változat szerint. E licenc egy példánya a GNU Szabad Dokumentációs Licenc című fejezetben olvasható. |
A mű a fenti licencek bármelyike szerint felhasználható.
Fájltörténet
Kattints egy időpontra, hogy a fájl akkori állapotát láthasd.
| Dátum/idő | Bélyegkép | Felbontás | Feltöltő | Megjegyzés | |
|---|---|---|---|---|---|
| aktuális | 2005. október 8., 22:01 | | 1 250 × 875 (110 KB) | Omegatron | last revision? |
| 2005. október 8., 21:41 |  | 1 250 × 875 (113 KB) | Omegatron | better | |
| 2005. október 8., 21:30 |  | 1 250 × 875 (117 KB) | Omegatron | The frequency response of a Butterworth filter with logarithmic axes (Bode plot) and various labels. Cutoff frequency is normalized to 1 rad/s. Gain is |
Fájlhasználat
Ezt a fájlt nem használja egyetlen lap sem.
Globális fájlhasználat
A következő wikik használják ezt a fájlt:
- Használata itt: eo.wikipedia.org
- Használata itt: eu.wikipedia.org
- Használata itt: fr.wikipedia.org
- Használata itt: he.wikipedia.org
- Használata itt: hi.wikipedia.org
- Használata itt: nn.wikipedia.org
- Használata itt: pl.wikipedia.org
- Használata itt: pt.wikipedia.org
- Használata itt: zh.wikipedia.org