
Fájl:Volcanic eruption map.svg

Ennek a(z) SVG fájlnak ezen PNG formátumú előnézete: 512 × 256 képpont. További felbontások: 320 × 160 képpont | 640 × 320 képpont | 1 024 × 512 képpont | 1 280 × 640 képpont | 2 560 × 1 280 képpont.
Eredeti fájl (SVG fájl, névlegesen 512 × 256 képpont, fájlméret: 362 KB)
|
Ez a fájl a Wikimedia Commonsból származik. Az alább látható leírás az ottani dokumentációjának másolata. A Commons projekt szabad licencű kép- és multimédiatár. Segíts te is az építésében! |
Összefoglaló
| Leírás |
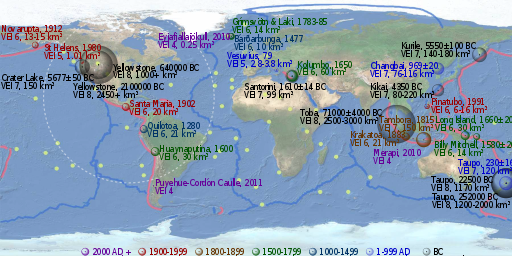
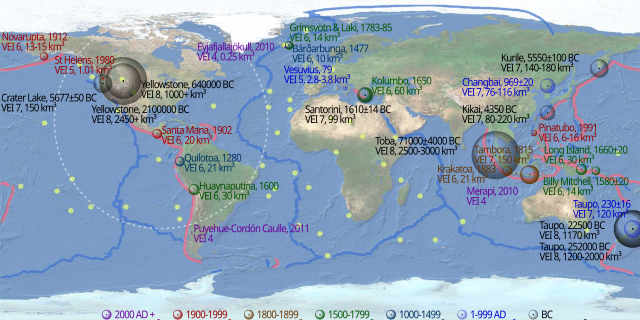
English: Map of notable volcanic eruptions. The apparent volume of each bubbles is linearly proportional to the volume of tephra ejected (i.e. their radius is linearly proportional to the cube root of the volume of tephra ejected), colour-coded by time of eruption as in the legend. Pink lines denote convergent boundaries, blue lines denote divergent boundaries and yellow spots denote hotspots. The dashed circle shows the equivalent ejection from the Chicxulub impact (200000+ km³).[1] The background map is extracted from https://earthquake.usgs.gov/learn/topics/plate_tectonics/majplatecolor.pdf and http://oceanexplorer.noaa.gov/okeanos/explorations/ex1103/logs/hires/hotspots_map_hires.jpg . |
| Dátum | (UTC) |
| Forrás |
Ez a fájl ebből származik: USGS majplatecolor.png: |
| Szerző |
|
| Más változatok |
|

- ↑ Starr, Evers, Starr, Biology: Concepts and Applications Without Physiology p.395
| Ez egy retusált kép, ami azt jelenti, hogy az eredetihez képest digitálisan módosították. Módosítások: Add volcanic eruptions, boundaries and hotspots. Az eredeti itt található: USGS majplatecolor.png. Módosította: Cmglee.
|
Licenc
Ez a fájl a Creative Commons Nevezd meg! – Így add tovább! 3.0 Unported licenc alapján használható fel.
- A következőket teheted a művel:
- megoszthatod – szabadon másolhatod, terjesztheted, bemutathatod és előadhatod a művet
- feldolgozhatod – származékos műveket hozhatsz létre
- Az alábbi feltételekkel:
- Nevezd meg! – A szerzőt megfelelően fel kell tüntetned, hivatkozást kell létrehoznod a licencre és jelezned kell, ha a művön változtatást hajtottál végre. Ezt bármilyen észszerű módon megteheted, kivéve oly módon, ami azt sugallná hogy a jogosult támogat téged vagy a felhasználásod körülményeit.
- Így add tovább! – Ha megváltoztatod, átalakítod, feldolgozod ezt a művet, a közreműködésedet csak az eredetivel megegyező vagy hasonló licenc alatt terjesztheted.
Eredeti feltöltési napló
This image is a derivative work of the following images:
- File:USGS_majplatecolor.png licensed with PD-USGov-USGS
- 2012-07-11T22:13:58Z Cmglee 4368x2205 (10477176 Bytes) Update to 24-bit PNG.
- 2012-07-11T22:11:29Z Cmglee 4368x2205 (4014441 Bytes) {{Information |Description ={{en|1=Equirectangular projection of world land and ocean visible plus elevation data, in faded colours suitable as background for further data visualisation. Extracted from PDF at http://earthq
Uploaded with derivativeFX
Fájltörténet
Kattints egy időpontra, hogy a fájl akkori állapotát láthasd.
| Dátum/idő | Bélyegkép | Felbontás | Feltöltő | Megjegyzés | |
|---|---|---|---|---|---|
| aktuális | 2013. szeptember 11., 19:43 | | 512 × 256 (362 KB) | Cmglee | Fix MIME type. |
| 2013. január 26., 04:45 |  | 512 × 256 (362 KB) | Cmglee | Previous upload failed; try again... | |
| 2013. január 26., 04:43 |  | 512 × 256 (362 KB) | Cmglee | Fix Merapi's year (thanks, '''Res'''Mar) | |
| 2012. július 13., 14:38 |  | 512 × 256 (362 KB) | Cmglee | Add Chixculub equivalent. | |
| 2012. július 13., 01:35 |  | 512 × 256 (361 KB) | Cmglee | Try uploading again. | |
| 2012. július 13., 01:34 |  | 512 × 256 (361 KB) | Cmglee | Reduce kerning. | |
| 2012. július 13., 01:32 |  | 512 × 256 (361 KB) | Cmglee | == {{int:filedesc}} == {{Information |Description={{en|1=Equirectangular projection of world land and ocean visible plus elevation data, in faded colours suitable as background for further data visualisation. Extracted from PDF at http://earthquake.usg... |
Fájlhasználat
Az alábbi lap használja ezt a fájlt:
Globális fájlhasználat
A következő wikik használják ezt a fájlt:
- Használata itt: en.wikipedia.org
- Használata itt: tr.wikipedia.org
- Használata itt: uk.wikipedia.org
- Használata itt: zh.wikipedia.org