
Fájl:Temperature1900-2004.png

Az előnézet mérete: 800 × 489 képpont További felbontások: 320 × 196 képpont | 640 × 391 képpont | 1 024 × 626 képpont | 1 280 × 782 képpont | 1 875 × 1 146 képpont.
Eredeti fájl (1 875 × 1 146 képpont, fájlméret: 50 KB, MIME-típus: image/png)
|
Ez a fájl a Wikimedia Commonsból származik. Az alább látható leírás az ottani dokumentációjának másolata. A Commons projekt szabad licencű kép- és multimédiatár. Segíts te is az építésében! |
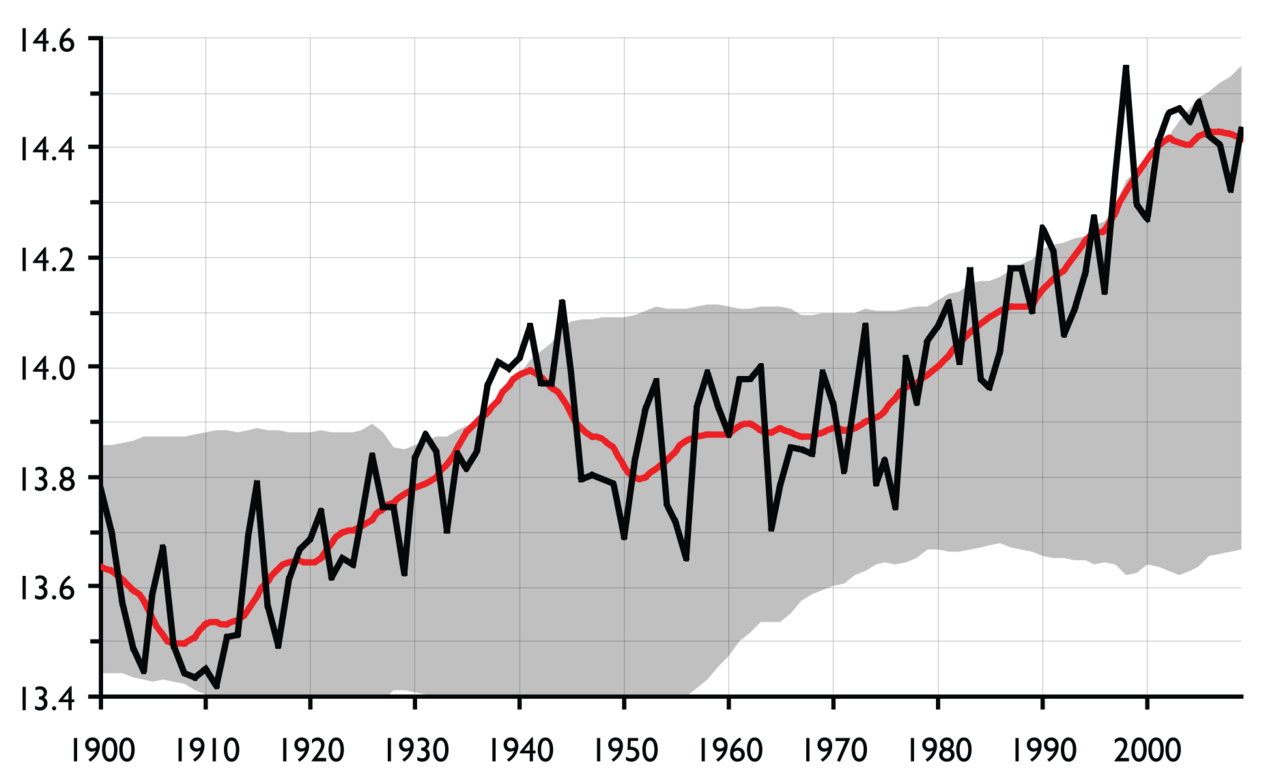
English: Description: Global temperature. Axes are not labelled in order to keep the diagram language neutral; x-axis: year (1900–2009), y-axis: global temperature in °C. The black line is the annual global mean. The red line is the 10-year running mean. The grey area is the 95% confidence interval of the same data, calculated for the 50 years up to and including each year's measurement.
The diagram illustrates several aspects of global warming, the most obvious of which is the increase in mean temperature. However, also the confidence interval has increased both in value (i.e., warmer climate) and in width (i.e., more variable temperature). Periods of rapid change are characterised by many measurements falling outside the confidence intervals. Two such periods can be identified: the late 30's / early 40's, and from the 80's to today. Temperature increase in those periods is due to anthropogenous effects, according to the IPCC.
The diagram illustrates several aspects of global warming, the most obvious of which is the increase in mean temperature. However, also the confidence interval has increased both in value (i.e., warmer climate) and in width (i.e., more variable temperature). Periods of rapid change are characterised by many measurements falling outside the confidence intervals. Two such periods can be identified: the late 30's / early 40's, and from the 80's to today. Temperature increase in those periods is due to anthropogenous effects, according to the IPCC.
Français : Description: Évolution de la température globale planétaire. Les axes ne sont pas étiquetés pour que le graphique reste linguistiquement neutre ; axe des x: année (1900-2009), axe des y: température globale en °C. En noir: moyenne mondiale annuelle. En rouge : moyenne des dix dernières années. Zone grise : intervalle de confiance à 95% des mêmes données (calculé pour les mesures de 50 ans à chaque année).
Le diagramme montre que la température moyenne tend à augmenter, mais avec du "bruit", c'est à dire des variations sur les périodes courtes. Cependant, l’intervalle de confiance a aussi augmenté : en valeur (=> climat plus chaud) et en largeur (=> Température plus variable). Certaines périodes de changement rapide sont caractérisées par de nombreuses mesures situées en dehors des intervalles de confiance. Deux de ces périodes peuvent être identifiées : la fin des années 30 / le début des années 40 et des années 80 à aujourd'hui. L’augmentation de la température pendant ces périodes est due à des effets anthropogènes, selon le GIEC.
- Note: The file name is not "correct" any more, as the graph now ends in 2009 rather than 2004. The estimate for 2009 is based on preliminary values for the first 8 months of the year.
- Source: graph drawn by Hanno using data published on the web (2009) as "HadCRUT3". Met Office Hadley Centre for Climate Change, U.K. [http://www.cru.uea.ac.uk/cru/data/temperature/]
- Licence: released into the public domain by the author
| Én, a szerző, ezt a művemet ezennel közkinccsé nyilvánítom. Ez a világ minden részén érvényes. Egyes országokban ez jogilag nem lehetséges. Ha így van, akkor: Jogot adok bárkinek, hogy bármilyen célból, feltétel nélkül használhassa ezt a fájlt, kivéve a törvény által kötelezően előírt feltételeket. |

|
Ezt a képet el kellene készíteni vektorgrafika használatával SVG fájlként. A formátumnak számos előnye van; lásd a Commons:Media for cleanup lapot a további információkért. Ha a képnek már elérhető SVG-formátumú változata, töltsd fel. Az SVG feltöltése után cseréld le ezt a sablont a következőre: {{vector version available|új kép neve.svg}}.
|
Fájltörténet
Kattints egy időpontra, hogy a fájl akkori állapotát láthasd.
| Dátum/idő | Bélyegkép | Felbontás | Feltöltő | Megjegyzés | |
|---|---|---|---|---|---|
| aktuális | 2016. október 3., 00:05 | | 1 875 × 1 146 (50 KB) | Cmdrjameson | Compressed with pngout. Reduced by 116kB (70% decrease). |
| 2009. október 14., 20:00 |  | 1 875 × 1 146 (166 KB) | Hanno | * '''Description:''' Global temperature. Axes are not labelled in order to keep the diagram language neutral; ''x''-axis: year (1900–2009), ''y''-axis: global temperature in °C. The black line is the annual global mean. The red line is the 10-year | |
| 2005. november 9., 18:39 |  | 1 200 × 780 (120 KB) | Hanno | ||
| 2005. október 26., 21:13 |  | 1 200 × 767 (90 KB) | Hanno | ||
| 2005. október 25., 13:33 |  | 1 200 × 767 (76 KB) | Hanno |
Fájlhasználat
Az alábbi lapok használják ezt a fájlt:
Globális fájlhasználat
A következő wikik használják ezt a fájlt:
- Használata itt: es.wikipedia.org
- Használata itt: ga.wikipedia.org
- Használata itt: nn.wikipedia.org